In this article we will discuss in detail about Prince Pipes share price target 2024, 2025, 2026, 2028, 2030, 2040 and 2050. Along with this, detailed information about the company’s fundamentals, share price history, revenue, expenses, balance sheet, and quarterly reports will be given. Which will help you in taking investment related decisions.
Prince Pipes and Fittings Limited was established in 1987. It is India’s largest PVC pipe manufacturers & multi polymer processor. This company manufactures products used in borewells, plumbing systems, electrical drain pipes, water storage tanks, industrial piping. Prince Pipes has 7 manufacturing units located at Haridwar (Uttarakhand), Athal (Dadra & Nagar Haveli), Dadra (Dadra & Nagar Haveli), Kolhapur (Maharashtra), Chennai (Tamil Nadu), Jobner. (Rajasthan) and Sangareddy (Telangana).
Prince Pipes has a global collaboration with Lubrizol, the world’s largest manufacturer and inventor of CPVC compounds, headquartered in the US. In 2021, Prince Pipes was named in the list of Fortune India 500 companies. Prince Pipes was the Brand of the Year at INEX Realty+ Awards in the year 2021.
Prince Pipes Fundamental
Prince Pipes and Fittings is a big name in the field of PVC pipes with a current market cap of Rs7428 crore. The company has registered net sales of ₹2584.84 crore and net profit of ₹182.50 crore in the financial year 2024. In the last three years, there has been a growth of 50.30% in the company’s profit but there has been a decline of 4.94% in its revenue. The total equity share capital of the company has remained stable at ₹110.56 crore for the last few years.
The reserves and surplus have been continuously increasing over the last few years, reaching ₹1,433.84 crore in March 2024. The debt to equity ratio of the company is 0.08. The company’s ROE is 11.82% and ROCE is 14% which shows satisfactory returns on equity and capital employed.
Company Name
Prince Pipes and Fittings ltd.
Sector
Plastics – Tubes/Pipes
Established
1987
Website
princepipes.com
Listing At
NSE, BSE
Mkt Cap
7428 Cr
ROE
11.82%
ROCE
14%
52 Week High
776
52 Week Low
521.35
P/E Ratio (TTM)
40.70
P/B Ratio
4.21
Debt to Equity
0.08
Face Value
10
Book Value Per Share
139.69
EPS (TTM)
16.51
Dividend Yield
0.15%
Net Sales
2584.84
Sales Growth
-4.94%
Net Profit (Anual)
182.50 Cr
Profit Growth
50.30%
Prince Pipes Fundamental
The company’s share has touched a high of Rs 776 and the lowest price of Rs 521.35 in the last 52 weeks. It has a dividend yield of 0.15% which promises generous but assured profits. Prince Pipes has a PE ratio of 40.70 which points towards overvalued.
Prince Pipes Share Price Target 2024 2025, 2026, 2028, 2030, 2040 And 2050
Prince Pipes was listed on NSE and BSE on 30 December 2019.
Prince Pipes Profit/Loss
Prince Pipes’ profit has increased by 50.30% compared to last year but has decreased compared to financial years 2021 and 2022. However, its revenue has been fluctuating slightly compared to the last 4 years. In the first quarter of this financial year, the company had made a profit of only Rs 19.62 crore which was the lowest and in the second quarter it had made a profit of Rs 70.63 crore which was the highest. Overall this year the company had made a profit of Rs 182.50 crore.
Item
Mar 24
Mar 23
Mar 22
Mar 21
Mar 20
Profit/Loss Before Exceptional, ExtraOrdinary Items And Tax
225.84
164.84
336.87
299.15
150.57
Exceptional Items
17.93
0.00
0.00
0.00
0.00
Profit/Loss Before Tax
243.77
164.84
336.87
299.15
150.57
Tax Expenses-Continued Operations
Current Tax
61.27
42.01
89.14
77.42
40.14
Deferred Tax
0.00
1.58
-1.09
-0.11
-1.35
Tax For Earlier Years
0.00
-0.17
-0.57
0.00
-0.73
Total Tax Expenses
61.27
43.42
87.47
77.32
38.07
Profit/Loss After Tax And Before ExtraOrdinary Items
182.50
121.42
249.40
221.83
112.51
Profit/Loss From Continuing Operations
182.50
121.42
249.40
221.83
112.51
Profit/Loss For The Period
182.50
121.42
249.40
221.83
112.51
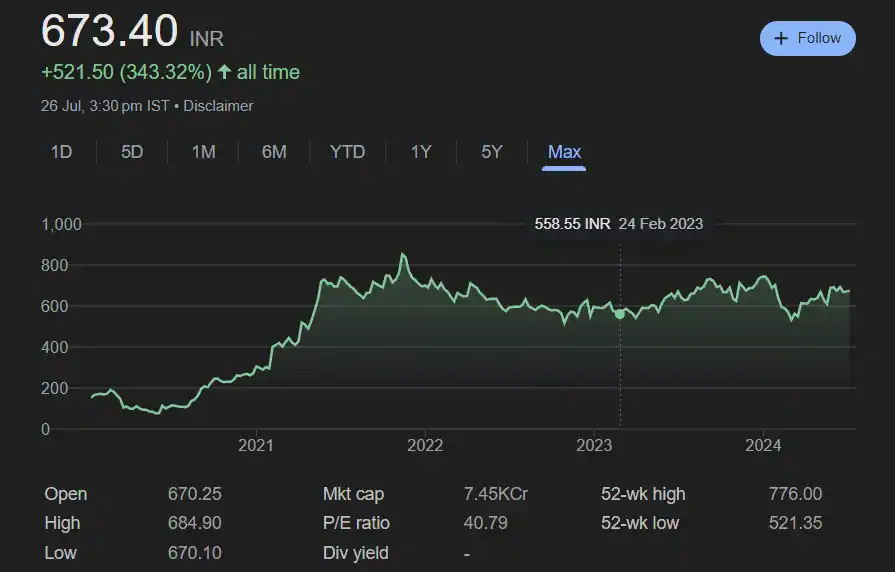
Prince Pipes Share Price Growth Chart
Prince Pipes Share Price History
Prince Pipes was listed on the Indian Stock Exchange at Rs 151 on December 30, 2019. Since then, its stock has grown by 343%. After listing, its shares saw a rise of 95.61% in the first year and 134.78% in the second year. However, its share fell by 14.83% in the third year. Its stock remained flat for the last 1 year and grew by only 2%. Its stock has fallen by 4.58% and 0.13% in last 6 months and 1 month respectively.
Prince Pipes Quarterly Report
Mar 24
Dec 23
Sep 23
Jun 23
Sales +
₹745.46Cr.
₹621.63Cr.
₹660.40Cr.
₹557.35Cr.
Expenses +
₹673.13Cr.
₹568.58Cr.
₹585.50Cr.
₹531.79Cr.
EBITDA
₹97.59Cr.
₹78.67Cr.
₹98.13Cr.
₹49.11Cr.
EBIT
₹73.68Cr.
₹55.76Cr.
₹93.53Cr.
₹27.30Cr.
Net Profit
₹54.65Cr.
₹37.63Cr.
₹70.63Cr.
₹19.62Cr.
Profit Before Tax
₹72.33Cr.
₹53.05Cr.
₹92.83Cr.
₹25.56Cr.
Operating Profit Margin
13.19%
12.72%
17.68%
8.87%
Net Profit Margin
7.38%
6.08%
8.68%
3.54%
Earning Per Share
₹4.94
₹3.40
₹6.39
₹1.77
Depreciation
23.91
22.91
22.53
21.81
Dividends Per Share
0.00
0.00
0.00
0.00
Prince Pipes Quarterly Report
Prince Pipes Profit/Loss – Last 5 Years Report
Income
Item
Mar 24
Mar 23
Mar 22
Mar 21
Mar 20
Revenue From Operations [Gross]
2,568.75
2,703.44
2,649.77
2,068.33
1,631.37
Revenue From Operations [Net]
2,568.75
2,703.44
2,649.77
2,068.33
1,631.37
Other Operating Revenues
0.00
7.43
7.06
3.18
4.29
Total Operating Revenues
2,568.75
2,710.87
2,656.83
2,071.52
1,635.66
Other Income
16.09
8.55
5.47
17.60
6.94
Total Revenue
2,584.84
2,719.42
2,662.30
2,089.12
1,642.60
Expenses
Item
Mar 24
Mar 23
Mar 22
Mar 21
Mar 20
Cost Of Materials Consumed
1,754.47
1,979.01
1,912.80
1,299.30
1,167.22
Purchase Of Stock-In Trade
73.17
78.59
67.01
34.66
48.49
Changes In Inventories Of FG,WIP And Stock-In Trade
-8.34
34.60
-88.32
44.89
-89.28
Employee Benefit Expenses
147.69
116.05
116.21
99.70
90.16
Finance Costs
6.50
11.01
13.90
20.67
33.17
Depreciation And Amortisation Expenses
91.17
83.01
70.31
59.42
51.98
Other Expenses
294.34
252.31
233.52
231.34
190.28
Total Expenses
2,359.00
2,554.58
2,325.43
1,789.97
1,492.03
Other Additional Information
Earnings Per Share
Item
Mar 24
Mar 23
Mar 22
Mar 21
Mar 20
Basic EPS (Rs.)
14.88
10.98
22.62
20.16
11.77
Diluted EPS (Rs.)
14.88
10.98
22.62
20.16
11.77
Dividend And Dividend Percentage
Item
Mar 24
Mar 23
Mar 22
Mar 21
Mar 20
Equity Share Dividend
0.00
0.00
38.51
16.50
13.26
Equity Dividend Rate (%)
10.00
0.00
35.00
35.00
10.00
Prince Pipes Balance Sheet – Last 5 Years Report:
Equities and Liabilities
Shareholder’s Funds
Item
MAR 24
MAR 23
MAR 22
MAR 21
MAR 20
Equity Share Capital
110.56
110.56
110.56
110.03
110.03
TOTAL SHARE CAPITAL
110.56
110.56
110.56
110.03
110.03
Reserves and Surplus
1,433.84
1,253.40
1,154.71
930.84
725.39
TOTAL RESERVES AND SURPLUS
1,433.84
1,253.40
1,154.71
930.84
725.39
TOTAL SHAREHOLDERS FUNDS
1,544.40
1,363.96
1,265.27
1,043.48
837.68
Non-Current Liabilities
Item
MAR 24
MAR 23
MAR 22
MAR 21
MAR 20
Long Term Borrowings
18.90
0.00
0.00
0.00
39.46
Deferred Tax Liabilities [Net]
19.06
13.66
12.28
13.31
13.31
Other Long Term Liabilities
9.87
3.07
0.00
15.89
17.42
Long Term Provisions
17.78
13.77
12.70
11.65
11.26
TOTAL NON-CURRENT LIABILITIES
65.62
30.50
24.98
40.85
81.45
Current Liabilities
Item
MAR 24
MAR 23
MAR 22
MAR 21
MAR 20
Short Term Borrowings
95.54
58.13
150.00
85.22
203.81
Trade Payables
249.14
320.20
398.58
249.11
180.78
Other Current Liabilities
165.90
79.44
98.02
185.72
104.40
Short Term Provisions
2.63
1.95
2.20
1.71
2.09
TOTAL CURRENT LIABILITIES
513.21
459.73
648.80
521.75
491.09
TOTAL CAPITAL AND LIABILITIES
2,123.23
1,854.19
1,939.04
1,606.08
1,410.21
ASSETS
NON-CURRENT ASSETS
Item
MAR 24
MAR 23
MAR 22
MAR 21
MAR 20
Tangible Assets
832.93
679.52
643.01
497.91
485.57
Intangible Assets
0.00
1.05
2.60
5.08
3.01
Capital Work-In-Progress
0.00
19.03
22.56
76.55
7.53
Other Assets
0.00
0.00
0.00
0.00
0.00
FIXED ASSETS
832.93
704.13
668.16
579.53
496.12
Non-Current Investments
0.29
0.29
1.69
1.46
0.63
Deferred Tax Assets [Net]
0.00
0.00
0.00
0.00
0.00
Long Term Loans And Advances
0.00
0.00
0.00
8.32
10.31
Other Non-Current Assets
43.51
24.59
42.48
31.04
58.41
TOTAL NON-CURRENT ASSETS
876.72
729.01
712.32
620.36
565.47
CURRENT ASSETS
Item
MAR 24
MAR 23
MAR 22
MAR 21
MAR 20
Current Investments
37.90
91.70
10.04
0.00
0.00
Inventories
437.89
425.65
618.81
227.33
344.52
Trade Receivables
584.87
415.02
434.62
353.37
179.71
Cash And Cash Equivalents
77.71
124.41
58.64
229.92
257.02
Short Term Loans And Advances
0.41
0.48
0.55
4.11
1.06
Other Current Assets
107.73
67.93
104.06
170.99
62.43
TOTAL CURRENT ASSETS
1,246.51
1,125.18
1,226.72
985.72
844.74
TOTAL ASSETS
2,123.23
1,854.19
1,939.04
1,606.08
1,410.21
OTHER ADDITIONAL INFORMATION
CONTINGENT LIABILITIES, COMMITMENTS
Item
MAR 24
MAR 23
MAR 22
MAR 21
MAR 20
Contingent Liabilities
0.00
48.08
102.91
182.97
126.13
CIF VALUE OF IMPORTS
Item
MAR 24
MAR 23
MAR 22
MAR 21
MAR 20
Raw Materials
0.00
0.00
0.00
0.00
0.00
Stores, Spares And Loose Tools
0.00
645.62
947.52
412.24
580.06
Trade/Other Goods
0.00
645.62
947.52
412.24
580.06
Capital Goods
0.00
0.00
0.00
0.00
0.00
EXPENDITURE IN FOREIGN EXCHANGE
Item
MAR 24
MAR 23
MAR 22
MAR 21
MAR 20
Expenditure In Foreign Currency
0.00
1.86
0.44
4.70
10.14
EARNINGS IN FOREIGN EXCHANGE
Item
MAR 24
MAR 23
MAR 22
MAR 21
MAR 20
FOB Value Of Goods
—
8.70
7.71
2.97
1.01
Other Earnings
—
—
—
—
—
BONUS DETAILS
Item
MAR 24
MAR 23
MAR 22
MAR 21
MAR 20
Bonus Equity Share Capital
—
81.01
How to Buy Prince Pipes Shares?
Shares of Prince Pipes can be bought and sold through any intermediate platform registered by SEBI. Here are the names of some popular platforms.
The debt to equity ratio of the company is low at 0.08 which shows good debt management and financial health of the company.
Continuous increase in the company’s shareholder funds.
A dividend yield of 0.15% guarantees assured returns to the investor.
The company’s better ROE of 11.82% and ROCE of 14% assures returns to the investors.
The company has been giving continuous profits for the last several years, which increases investor confidence.
Its reserves and surplus have continuously increased.
Prince Pipes Risks
The PE ratio of the company is 40.70 which indicates that it is overvalued.
Its revenue is 4.94% loss compared to last year, if this continues then its profit will also be affected.
Points to Consider Before Investing
Before investing in this company, the investor should keep an eye on its revenue and profit.
Plastics – Tubes/Pipes sector is very competitive.
The company’s stock is overvalued.
Investors should keep an eye on its ROE, ROCE and dividend yield.
Competitors of Prince Pipes
Supreme Industries
Ashirvad Pipes
Savera Pipes
Dutron Pipes
Apollo Pipes
Kankai Pipes
Profitable Stocks
Company Name
Mkt cap
Profit (1Year)
52W L
52W H
Indian Energy Exchange Ltd
₹15,520Cr.
36.28%
₹119
₹191
IIFL Securities Ltd
₹5,834Cr.
194.30%
₹63.0
₹240
Man Infraconstruction Ltd
₹7,351Cr.
59.62%
₹119
₹249
Marksans Pharma Ltd
₹9,224Cr.
77.29%
₹93.8
₹205
Ashoka Buildcon Ltd
₹7,310Cr.
154.59%
₹89.0
₹262
Conclusion
The company is in a strong position with consistent profit growth and effective debt management. Its fundamentals indicate a positive financial position, yet a cautious outlook on its financial position is warranted. In which emphasis is laid on the need for constant monitoring of sales performance and market conditions.
Disclaimer – Please note that we are not SEBI-registered advisors. Our post is for educational purposes only. Therefore, before investing in any share, take advice from a SEBI certified expert. If you invest, you yourself will be responsible for your profit and loss, not us.
Q1. What is the Market Cap of Prince Pipes?
Ans: The present Market Capital of Prince Pipes is ₹7428Cr.
Q2. When was Prince Pipes listed in the Indian market?
Ans: Prince Pipes was successfully listed on the Indian markets NSE and BSE on 30 December 2019.
Q3. What is the current Dept to equity Ratio of Prince Pipes?
Ans: Till FY March 2024, the company’s Dept to equity has been 0.08.
Q4. What is Prince Pipes share price target 2024?
Ans: Prince Pipes share price target for 2024 is going to be between Rs.536 to Rs.736.
Q5. What is Prince Pipes share price target 2025?
Ans: Prince Pipes share price target for 2025 is going to be between Rs.672 to Rs.731.
Q6. What is Prince Pipes share price target 2026?
Ans: Prince Pipes share price target for 2026 is going to be between Rs.699 to Rs.769.
Q7. What is Prince Pipes share price target 2030?
Ans: Prince Pipes share price target for 2030 is going to be between Rs.1080 to Rs.1196.
Q8. What is Prince Pipes share price target 2040?
Ans: Prince Pipes share price target for 2040 is going to be between Rs.1839 to Rs.2031.
Q9. What is Prince Pipes share price target 2050?
Ans: Prince Pipes share price target for 2050 is going to be between Rs.2814 to Rs.3026.