
We have brought for you analysis based detailed report for Jio Financial Services share price target 2024, 2025, 2026, 2028, 2030, 2040, 2050. If you are thinking of investing in the stock market then you must take a look at Jio Finance Services share price target.
What is Jio Financial Services Ltd
Jio Financial Services Ltd is a subsidiary of Reliance Industries. In July 2023, Reliance Strategic Investment Limited was renamed Jio Financial Services Limited. It is a company providing financial services such as payment solutions, insurance, and asset management in India. Jio Financial Services and BlackRock (the world’s largest asset manager) will work together to provide financial services in India.
Jio Financial Services listing Date
This company was listed in the stock exchange on 21 August 2023. But in September it was removed from the BSE and FTSE indices.
Jio Financial Services Share Price History
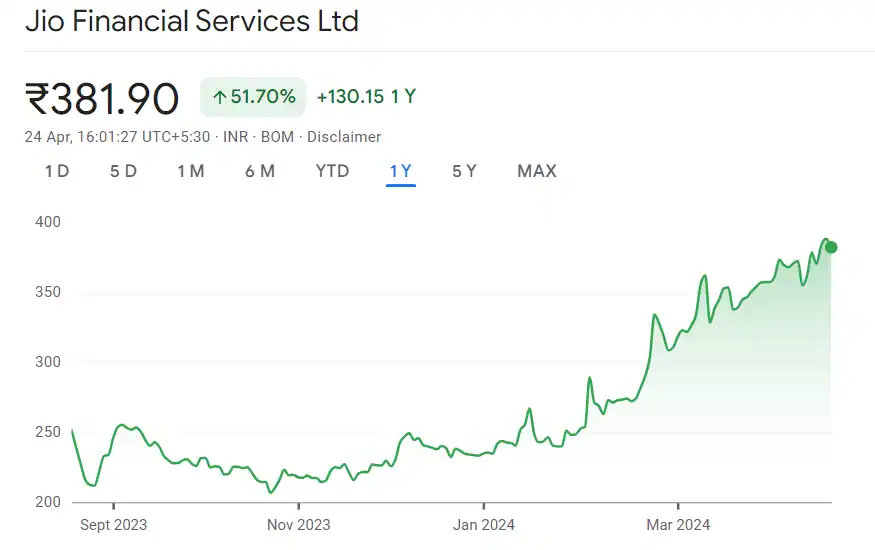
Jio Financial Services was listed on BSE on 21 August 2023 at Rs 265 per share, and today on 24 April 2024 it has become Rs 379 per share with a growth of 79%. In the last 1 year, 6 months, and 1 month, its stock has seen a growth rate of 50.90%, 80.73%, and 9.70% respectively. It has seen a very slight (0.45%) decline in the last 5 days. With this its market cap has increased to Rs 2.42 trillion (2.42 lakh crore).
Jio Financial Services Share price growth chart
Jio Financial Services Fundamentals
Jio financial services is a significant player in the financial sector with a market cap of ₹2,42,886 crore, indicating strong market presence and investor confidence. The company has shown an impressive sales growth rate of 1432.69% in the last fiscal year, indicating strong expansion and successful business strategies of the company.
The company has consistently made profits for the last several years. The company’s profit for the financial year 23-24 has seen an increase of 1123.90%. Which is a strong indicator of a company’s operational efficiency and financial health.
Jio Financial Services has ROE of 1.5% and ROCE of 2.17% which is relatively low. The 1.58 P/B ratio suggests that the company’s stock is priced fairly compared to its book value, potentially making it an attractive investment opportunity.
| Company Name | Jio Financial Services Ltd |
| Sector | Financial Services |
| Established | July 22, 1999, |
| Website | www.jfs.in |
| Market Cap | ₹ 2,42,886 Cr. |
| Advances | ₹ 0 Cr. |
| No. of Shares | 635.33 Cr. |
| P/E Ratio (TTM) | 136.36 |
| P/B Ratio | 1.58 |
| 52 Week High | Rs 394.70 |
| 52 Week Low | Rs 202.80 |
| Face Value | 10 |
| Dividend Yield | 00.00% |
| Book Value | ₹ 119.02 |
| Net Profit | ₹ 382.47 Cr. |
| Profit Growth | 1123.90% |
| EPS (TTM) | 2.53 |
| Sales Growth | 1432.69% |
| ROE | 1.15% |
| ROCE | 2.17% |
Jio Financial Services Profit/Loss – Last 5 Years Report
Income Report
| Description | Mar 24 | Mar 23 | Mar 22 | Mar 21 | Mar 20 |
|---|---|---|---|---|---|
| 12 months | 12 mths | 12 mths | 12 mths | 12 mths | 12 mths |
| Revenue From Operations [Gross] | 638.06 | 41.63 | 148.61 | 295.18 | 349.25 |
| Revenue From Operations [Net] | 638.06 | 41.63 | 148.61 | 295.18 | 349.25 |
| Total Operating Revenues | 638.06 | 41.63 | 148.61 | 295.18 | 349.25 |
| Other Income | 0.00 | 3.21 | 35.65 | 15.63 | 0.00 |
| Total Revenue | 638.06 | 44.84 | 184.26 | 310.81 | 349.25 |
Expenses
| Description | Mar 24 | Mar 23 | Mar 22 | Mar 21 | Mar 20 |
|---|---|---|---|---|---|
| 12 months | 12 mths | 12 mths | 12 mths | 12 mths | 12 mths |
| Employee Benefit Expenses | 42.73 | 0.00 | 0.00 | 0.00 | 0.00 |
| Finance Costs | 10.27 | 0.00 | 0.00 | 110.57 | 127.76 |
| Provisions and Contingencies | 0.00 | -10.06 | 0.00 | 0.00 | 0.00 |
| Depreciation And Amortisation Expenses | 12.31 | 0.00 | 0.00 | 0.00 | 0.00 |
| Other Expenses | 51.75 | 5.56 | 7.39 | 82.18 | 27.66 |
| Total Expenses | 117.06 | -4.50 | 7.39 | 192.75 | 155.42 |
Jio Financial Services Profit/Loss
| Description | Mar 24 | Mar 23 | Mar 22 | Mar 21 | Mar 20 |
|---|---|---|---|---|---|
| 12 months | 12 mths | 12 mths | 12 mths | 12 mths | 12 mths |
| Profit/Loss Before Exceptional, ExtraOrdinary Items And Tax | 521.00 | 49.34 | 176.87 | 118.06 | 193.83 |
| Profit/Loss Before Tax | 521.00 | 49.34 | 176.87 | 118.06 | 193.83 |
Tax Expenses
| Description | Mar 24 | Mar 23 | Mar 22 | Mar 21 | Mar 20 |
|---|---|---|---|---|---|
| 12 months | 12 mths | 12 mths | 12 mths | 12 mths | 12 mths |
| Current Tax | 138.53 | 10.00 | 10.20 | 3.40 | 12.90 |
| Deferred Tax | 0.00 | 9.39 | -1.37 | -8.71 | -49.01 |
| Tax For Earlier Years | 0.00 | -1.30 | 0.00 | 0.31 | 0.00 |
| Total Tax Expenses | 138.53 | 18.09 | 8.83 | -5.00 | -36.11 |
Profit/Loss After Tax
| Description | Mar 24 | Mar 23 | Mar 22 | Mar 21 | Mar 20 |
|---|---|---|---|---|---|
| 12 months | 12 mths | 12 mths | 12 mths | 12 mths | 12 mths |
| Profit/Loss After Tax And Before ExtraOrdinary Items | 382.47 | 31.25 | 168.04 | 123.06 | 229.94 |
| Profit/Loss From Continuing Operations | 382.47 | 31.25 | 168.04 | 123.06 | 229.94 |
| Profit/Loss For The Period | 382.47 | 31.25 | 168.04 | 123.06 | 229.94 |
Other Additional Information
| Description | Mar 24 | Mar 23 | Mar 22 | Mar 21 | Mar 20 |
|---|---|---|---|---|---|
| 12 months | 12 mths | 12 mths | 12 mths | 12 mths | 12 mths |
| Basic EPS (Rs.) | 0.60 | 60.46 | 325.13 | 238.10 | 1,138.21 |
| Diluted EPS (Rs.) | 0.60 | 60.46 | 325.13 | 238.10 | 444.90 |
Dividend
| Description | Mar 24 | Mar 23 | Mar 22 | Mar 21 | Mar 20 |
|---|---|---|---|---|---|
| 12 months | 12 mths | 12 mths | 12 mths | 12 mths | 12 mths |
| Equity Share Dividend | 0.00 | 888.92 | 0.00 | 0.00 | 0.00 |
| Equity Dividend Rate (%) | 0.00 | 44,000.00 | 0.00 | 0.00 | 0.00 |
Jio Financial Services Balance Sheet – Last 5 Years Report
Equities and Liabilities
| Description | Mar 24 | Mar 23 | Mar 22 | Mar 21 | Mar 20 |
|---|---|---|---|---|---|
| 12 months | 12 mths | 12 mths | 12 mths | 12 mths | 12 mths |
| Shareholder’s Funds | |||||
| Equity Share Capital | 6,353.28 | 2.02 | 2.02 | 2.02 | 2.02 |
| Total Share Capital | 6,353.28 | 2.02 | 2.02 | 2.02 | 2.02 |
| Reserves and Surplus | 18,083.53 | 17,698.64 | 2,225.70 | 2,057.97 | 1,934.91 |
| Total Reserves and Surplus | 18,083.53 | 17,698.64 | 2,225.70 | 2,057.97 | 1,934.91 |
| Total Shareholders Funds | 24,436.81 | 17,700.66 | 2,227.72 | 2,059.99 | 1,936.93 |
| Equity Share Application Money | 0.00 | 6,353.28 | 0.00 | 0.00 | 0.00 |
| Hybrid/Debt/Other Securities | 0.00 | 0.31 | 0.31 | 0.00 | 0.00 |
| Non-Current Liabilities | |||||
| Deferred Tax Liabilities [Net] | 17.18 | 4.08 | 0.00 | 0.00 | 4.77 |
| Other Long Term Liabilities | 3.71 | 0.10 | 0.02 | 0.07 | 344.84 |
| Long Term Provisions | 12.93 | 1.81 | 0.00 | 0.00 | 17.65 |
| Total Non-Current Liabilities | 33.82 | 5.99 | 0.02 | 0.07 | 367.26 |
| Current Liabilities | |||||
| Short Term Borrowings | 0.00 | 742.77 | 0.00 | 0.00 | 2,420.25 |
| Trade Payables | 2.39 | 0.00 | 0.00 | 0.00 | 0.04 |
| Other Current Liabilities | 1.18 | 0.09 | 0.07 | 0.17 | 58.96 |
| Total Current Liabilities | 3.57 | 742.86 | 0.07 | 0.17 | 2,479.25 |
| Total Capital And Liabilities | 24,474.20 | 24,803.10 | 2,228.12 | 2,060.23 | 4,783.44 |
Assets
| Description | Mar 24 | Mar 23 | Mar 22 | Mar 21 | Mar 20 |
|---|---|---|---|---|---|
| 12 months | 12 mths | 12 mths | 12 mths | 12 mths | 12 mths |
| Non-Current Assets | |||||
| Tangible Assets | 36.53 | 38.93 | 0.00 | 0.00 | 0.00 |
| Intangible Assets | 0.00 | 9.87 | 0.00 | 0.00 | 0.00 |
| Fixed Assets | 36.53 | 48.80 | 0.00 | 0.00 | 0.00 |
| Deferred Tax Assets [Net] | 0.00 | 0.00 | 5.31 | 3.94 | 0.00 |
| Other Non-Current Assets | 29.25 | 23.99 | 40.39 | 47.34 | 0.00 |
| Total Non-Current Assets | 65.78 | 72.79 | 45.70 | 51.28 | 0.00 |
| Current Assets | |||||
| Current Investments | 19,719.97 | 19,400.57 | 180.90 | 57.49 | 206.09 |
| Trade Receivables | 0.00 | 0.00 | 0.00 | 0.00 | 7.65 |
| Cash And Cash Equivalents | 4,590.20 | 5,000.17 | 0.51 | 0.36 | 0.49 |
| Short Term Loans And Advances | 92.00 | 0.00 | 2,001.00 | 1,951.09 | 4,400.15 |
| Other Current Assets | 6.25 | 329.57 | 0.01 | 0.01 | 169.06 |
| Total Current Assets | 24,408.42 | 24,730.31 | 2,182.42 | 2,008.95 | 4,783.44 |
| Total Assets | 24,474.20 | 24,803.10 | 2,228.12 | 2,060.23 | 4,783.44 |
Other Additional Information
| Description | Mar 24 | Mar 23 | Mar 22 | Mar 21 | Mar 20 |
|---|---|---|---|---|---|
| 12 months | 12 mths | 12 mths | 12 mths | 12 mths | 12 mths |
| Contingent Liabilities, Commitments | |||||
| Contingent Liabilities | 0.00 | 3.19 | 18.77 | 6.67 | 7.12 |
Jio Financial Services Quarterly Report
| Mar 24 | Dec 23 | Sep 23 | Jun 23 | |
| Sales + | 140.51 | 134.08 | 148.90 | 214.57 |
| Expenses + | 36.50 | 36.34 | 25.34 | 18.88 |
| EBITDA | 3.06 | 3.09 | 3.10 | 3.06 |
| EBIT | 104.01 | 97.74 | 123.56 | 205.96 |
| Net Profit | 77.76 | 70.48 | 88.76 | 145.47 |
| Profit Before Tax | 104.01 | 97.74 | 123.56 | 195.69 |
| Operating Profit Margin | 76.20% | 75.20% | 85.06% | 97.41% |
| Net Profit Margin | 55.34% | 52.57% | 59.61% | 67.80% |
| Earning Per Share | 0.12 | 0.11 | 0.14 | 720.14 |
| Depreciation | 5.36 | 13.66 | 13.29 | 13.35 |
| Dividends Per Share | 0.00 | 0.00 | 0.00 | 0.00 |
Jio Financial Services Share Price Target 2024, 2025, 2026, 2028, 2030, 2040, and 2050
Jio Financial Services Share Price Target 2024
Speaking to ET NOW Swadesh, market expert Dhawni Patel said that Jio Financial Services shares are showing an upward trend. He said that if it crosses Rs 410 then the rise will continue.
| Month | Minimum Target (₹) | Maximum Target (₹) |
|---|---|---|
| January | 210 | 250 |
| February | 255 | 310 |
| March | 310 | 350 |
| April | 356 | 390 |
| May | 380 | 410 |
| June | 390 | 420 |
| July | 398 | 425 |
| August | 405 | 435 |
| September | 415 | 440 |
| October | 416 | 445 |
| November | 420 | 440 |
| December | 425 | 450 |
Jio Financial Services Share Price Target 2025
| Month | Minimum Target (₹) | Maximum Target (₹) |
|---|---|---|
| January | 440 | 460 |
| February | 445 | 465 |
| March | 450 | 470 |
| April | 455 | 475 |
| May | 460 | 480 |
| June | 465 | 485 |
| July | 470 | 490 |
| August | 475 | 495 |
| September | 480 | 500 |
| October | 485 | 505 |
| November | 490 | 510 |
| December | 495 | 515 |
Jio Financial Services Share Price Target 2026
| Month | Minimum Target (₹) | Maximum Target (₹) |
|---|---|---|
| January | 520 | 535 |
| February | 525 | 540 |
| March | 535 | 550 |
| April | 540 | 560 |
| May | 545 | 565 |
| June | 555 | 570 |
| July | 560 | 575 |
| August | 565 | 600 |
| September | 575 | 610 |
| October | 580 | 615 |
| November | 590 | 625 |
| December | 600 | 635 |
Also Read: Strong growth, Yatra Online shares will make you a millionaire.
Jio Financial Services Share Price Target 2028
| Month | Minimum Target (₹) | Maximum Target (₹) |
|---|---|---|
| January | 710 | 725 |
| February | 715 | 730 |
| March | 720 | 740 |
| April | 730 | 745 |
| May | 730 | 750 |
| June | 735 | 755 |
| July | 740 | 760 |
| August | 750 | 770 |
| September | 755 | 775 |
| October | 760 | 785 |
| November | 770 | 795 |
| December | 790 | 805 |
Jio financial services share prediction: expert opinion
Jio Financial Services Share Price Target 2030
| Month | Minimum Target (₹) | Maximum Target (₹) |
|---|---|---|
| January | 910 | 935 |
| February | 915 | 945 |
| March | 920 | 950 |
| April | 925 | 955 |
| May | 930 | 960 |
| June | 935 | 965 |
| July | 940 | 970 |
| August | 940 | 975 |
| September | 950 | 985 |
| October | 960 | 990 |
| November | 965 | 990 |
| December | 975 | 1010 |
Jio Financial Services Share Price Target 2040
| Month | Minimum Target (₹) | Maximum Target (₹) |
|---|---|---|
| January | 1510 | 1535 |
| February | 1515 | 1545 |
| March | 1520 | 1550 |
| April | 1525 | 1555 |
| May | 1530 | 1560 |
| June | 1535 | 1565 |
| July | 1540 | 1570 |
| August | 1540 | 1575 |
| September | 1550 | 1585 |
| October | 1560 | 1590 |
| November | 1575 | 1597 |
| December | 1584 | 1615 |
Jio Financial Services Share Price Target 2050
| Month | Minimum Target (₹) | Maximum Target (₹) |
|---|---|---|
| January | 2246 | 2262 |
| February | 2253 | 2269 |
| March | 2257 | 2274 |
| April | 2263 | 2278 |
| May | 2267 | 2286 |
| June | 2271 | 2289 |
| July | 2277 | 2296 |
| August | 2281 | 2305 |
| September | 2287 | 2309 |
| October | 2291 | 2313 |
| November | 2297 | 2320 |
| December | 2304 | 2328 |
How to buy Jio Financial Services share price?
Popular platforms for buying Jio Financial services shares are UPstox, Groww, Zerodha and Angleone, from where you can easily buy and sell JFS shares.
Also Read: HCC shares will make you rich, 100% guarantee.
Jio Financial Services Shareholding Pattern
| Promoter | 47.12% |
| Other Domestic Institutions | 7.86% |
| Retail and Others | 20.83% |
| Foreign Institutions | 19.45% |
| Mutual funds | 4.74% |
| Total | 100.00 |
Latest News
1. Jio Financial Services is about to launch its JFS Super App in which all finance related facilities like loan, investment, insurance, payment, digital banking, upi and mutual fund services will be available at one place.
2. Jio Finance is going to create a big headache for fintech startups. Fintech companies like Paytm, phone pay, google pay, Zerodha will have to face tough competition.
3. JFS has joined hands with the world’s largest asset manager American company to provide financial services in India. Initially both the companies have set a target of investing $150 million.
4. Public shareholders hold 52.88% stake in Jio Financial Services while promoters hold 47.12%, hence the company has sought shareholders’ approval for foreign investment up to 49%.
Strengths
- The net profit of the company for the financial year 2023-24 is ₹ 382.47 crore.
- Total shareholder funds has increased significantly between March 2020 and March 2024 indicating strong growth. Total shareholders’ funds in March 2020 stood at Rs 1,936.93 crore. And in March 2024 it was Rs 24,436.81 crore.
- The reserves and surplus of any company indicate its financial stability and ability to absorb potential losses. In March 2020, the company had reserves of Rs 1,934.91 crore, which increased to Rs 18,083.53 crore in March 2024.
- Jio Financial Services has no long-term borrowings, which reflects the strong position of the company.
- Having a debt-free status, the company is free from interest expenses and financial risk.
- The company’s current investments have grown rapidly reflecting efficient asset management and liquidity.
Risks
- JFS has a fairly high P/E ratio, which suggests the stock may be overvalued. Investors may pay a premium for future growth, which increases the risk if the company fails to meet high growth expectations.
- JFS’s ROE and ROCE are relatively low which suggests that the company is not generating high returns on its equity and capital.
- The company’s EPS is relatively modest compared to the high P/E ratio.
- Jio Financial Services has a P/E ratio of 136.36 which means the stock is trading at a high multiple of its earnings, which could indicate that the stock is overvalued.
Competitors of Jio Financial Services
- Shriram Finance
- Anand Rathi Wealth
- Bajaj Finance
- SBI Cards and Payment Services
- Sundaram Finance
- Muthoot Finance
Similar Stocks
| Stocks | Mkt cap | Profit (1Year) | 52W L | 52W H |
|---|---|---|---|---|
| SBI Cards and Payment Services | ₹69.55 KCr | -21.21% | ₹647.95 | ₹933.00 |
| Aditya Birla Capital | ₹61.73 KCr | 36.14% | ₹155.00 | ₹243.70 |
| L&T Finance | ₹41.17 KCr | 4.68% | ₹144.60 | ₹179.18 |
| Max Financial Services | ₹34.10 KCr | 46.32% | ₹668.30 | ₹1092.00 |
| IDFC | ₹18.33 KCr | 10.43% | ₹96.50 | ₹137.00 |
| Anand Rathi Wealth | ₹16.34 KCr | 354.40% | ₹851.10 | ₹4219.95 |
| SBFC Finance | ₹9.14 KCr | -7.60% | ₹72.40 | ₹98.00 |
Also Read: Indian Railway stock grows 500%, millionaire in 1 year.
Profitable Stocks
| Stocks | Mkt cap | Profit (1Year) | 52W L | 52W H |
|---|---|---|---|---|
| Adani ports | ₹3.11 LCr | 94.78% | ₹703.00 | ₹1,457.05 |
| Adani Enterprises | ₹3.89 LCr | 40.35% | ₹2142.00 | ₹3457.85 |
| Tata Power Company | ₹1.44 LCr | 101.76% | ₹215.70 | ₹464.20 |
| Adani Power | ₹2.92 LCr | 192.93% | ₹231.00 | ₹797.00 |
| Havells India | ₹1.20 LCr | 41.69% | ₹1232.85 | ₹1950.05 |
| Tata Motors | ₹3.57 LCr | 72.86% | ₹557.70 | ₹1065.60 |
| Adani Total Gas | ₹1.14 LCr | 53.34% | ₹522.00 | ₹1259.40 |
Conclusion
Jio Financial Services has demonstrated exceptional growth rates in market capitalization, sales and profits, indicating strong business expansion and improving profitability.The company’s JFS app and its partnership with a big asset manager company like BlackRock indicate strong growth in its stock. However, the company’s low ROE and lack of ROCE present potential risks. A high P/E ratio suggests that the market has high expectations of future growth, which can be risky if the company does not meet these expectations. Investors should consider these strengths and risks when considering Jio Financial Services as an investment.
Disclaimer – Please note that we are not SEBI-registered advisors. Our post is for educational purposes only. Therefore, before investing in any share, take advice from a SEBI certified expert. If you invest, you yourself will be responsible for your profit and loss, not us.
Also Read:
IRFC Share Price Target 2024, 2025, 2026, 2028, 2040 and 2050
Q1: What is the target price of Jio Financial Services in 2024?
Ans: The maximum share price target of Jio financial services for 2024 is likely to be Rs 420 to Rs 450.
Q2: Is it a good time to buy Jio financial services shares?
Ans: Yes, recently the world’s largest asset manager BlackRock has partnered with Jio Financial Services. This means that JFS shares will see an increase.
Q3: What is the share price of Jio Financial Services in 2025?
Ans: The maximum share price target of Jio financial services for 2025 is likely to be Rs 495 to Rs 515.
Q4: What is the share price of Jio Financial Services in 2026?
Ans: The maximum share price target of Jio financial services for 2026 is likely to be Rs 600 to Rs 635.