Glenmark Share Price Target 2024, 2025, 2026, 2028, 2030, 2040 and 2050

Unlock the potential of Glenmark Pharmaceutical’s stock with expert-estimated price targets for 2024, 2025, 2026, 2028, 2030, 2040 and 2050. Stay ahead of market trends and make informed investment decisions with our comprehensive analysis.

What is Glenmark Pharmaceutical

Glenmark Pharmaceutical is a global company founded in 1977 by Gracias Saldanha, which manufactures generic and OTC medicines. Its main areas of work are dermatology, oncology, and respiratory. In the initial phase it sold its products in India, Russia and Africa. Currently, it has 10 world-class manufacturing companies spread across 5 continents, 4 research centers and operations in more than 80 countries. As of 2023, the company has 15,556 employees.

Glenmark Pharmaceutical has been awarded the EY Entrepreneur of the Year (Life Sciences and Healthcare category, India) in 2017. Apart from this, the company has also been honored with the India Pharma Leader Award by the Department of Pharmaceuticals, Ministry of Chemicals and Fertilizers, Government of India in 2015.

Glenmark Listing date

Glenmark Pharmaceutical was listed on NSE and BSE on 7 February 2000. At the time of listing its share price was Rs 24.95 and today on 17 May 2024 its share price is Rs 1021.50.

ParameterValue
Face Value of Equity Shares1
Market Lot of Equity Shares1
Listed OnBSE Ltd. , National Stock Exchange of India Ltd.
Listing date7 Feb 2000
BSE Code532296
NSE CodeGLENMARK
BSE GroupA

Glenmark Share Price History

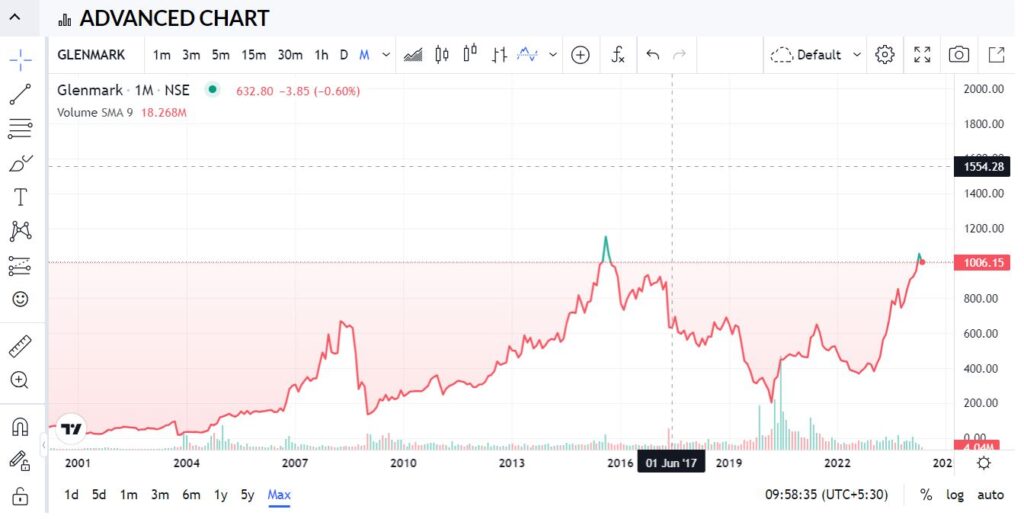
Since its listing in the stock exchange, there has been a continuous growth in its share price. When it was listed in 2000, the share price of Glenmark Pharma was Rs 24.95 and today its shares have increased by 3994% to Rs 1021.50. Let us see the growth or loss of Glenmark Pharma’s share in a few years through a chart.

Glenmark Share Price growth chart

Glenmark Pharma Ltd. Share Price growth chart

Price Performance% growth
1 Week-1.33%
1 Month-3.46%
3 Months24.39%
YTD18.03%
1 Year65.79%
3 Years65.69%

Glenmark Pharmaceutical Fundamental

Fundamental and technical analysis of the company shows that the company can give good returns in future. Long term investors should focus on its shares.

Company NameGlenmark Pharma Ltd.
Sector Pharmaceuticals & Drugs
Websiteglenmarkpharma.com
Mrket Cap28,392Cr
Listing AtNSE and BSE
52 Week High1,098.00
52 Week Low581.00
P/E Ratio (TTM)-39.89
P/B Ratio3.04
Face Value1
Dividend Yield0.25%
Book Value Per Share330.53
Net Profit (Anual)1,208.77
EPS (TTM)-25.22
Net Sales9206.60Cr
Sales Growth5.14%
ROE6.48%
ROCE10.81
Profit Growth28.96%
All data is taken from moneycontrol

Glenmark Pharmaceutical Profit/Loss – Last 5 Years Report

Glenmark Pharmaceutical Income Report

IncomeMar 23Mar 22Mar 21Mar 20Mar 19
12 mths12 mths12 mths12 mths12 mths
Revenue From Operations [Gross]8,019.678,017.387,450.916,491.206,131.14
Revenue From Operations [Net]8,019.678,017.387,450.916,491.206,131.14
Other Operating Revenues201.00124.20117.02221.43173.73
Total Operating Revenues8,220.668,141.587,567.936,712.636,304.87
Other Income985.94614.63396.24606.79475.61
Total Revenue9,206.608,756.217,964.177,319.426,780.48
All data is taken from moneycontrol

Glenmark Pharmaceutical Expenses

ExpenseMar 23 Mar 22Mar 21 Mar 20Mar 19
12 mths12 mths12 mths12 mths12 mths
Cost Of Materials Consumed3,035.882,993.042,678.262,251.981,585.85
Purchase Of Stock-In Trade391.19481.62315.96365.24301.30
Changes In Inventories Of FG,WIP And Stock-In Trade-31.37-16.135.2448.77471.81
Employee Benefit Expenses1,346.511,193.201,107.401,072.33969.98
Finance Costs206.82236.04265.90256.39223.81
Depreciation And Amortisation Expenses184.15159.70150.82138.54106.28
Other Expenses2,005.681,801.641,570.741,670.081,648.45
Total Expenses7,138.866,849.106,094.315,803.335,307.48
All data is taken from moneycontrol

Glenmark Pharmaceutical Profit/Loss

Profit/LossMar 23 Mar 22Mar 21Mar 20Mar 19
12 mths12 mths12 mths12 mths12 mths
Profit/Loss Before Exceptional, ExtraOrdinary Items And Tax2,067.741,907.111,869.871,516.091,473.00
Profit/Loss Before Tax1,571.872,337.451,943.761,534.641,818.18
Profit/Loss From Continuing Operations1,208.771,997.791,649.451,354.551,488.30
Profit/Loss For The Period1,208.771,997.791,649.451,354.551,622.11

Other Additional Information

EARNINGS PER SHAREMar 23Mar 22Mar 21Mar 20Mar 19
12 mths12 mths12 mths12 mths12 mths
Basic EPS (Rs.)42.8470.8058.4648.0057.49
Diluted EPS (Rs.)42.8470.8058.4648.0057.49
DIVIDEND AND DIVIDEND PERCENTAGE
Equity Share Dividend70.5470.5470.5468.0368.03
Equity Dividend Rate (%)250.00250.00250.00250.00200.00
All data is taken from moneycontrol

Glenmark Pharma Ltd. Balance Sheet – Last 5 Years Report:

EQUITIES AND LIABILITIES

EQUITIES AND LIABILITIESMar 23Mar 22Mar 21Mar 20Mar 19
SHAREHOLDER’S FUNDS12mnths12mnths12mnths12mnths12mnths
Equity Share Capital28.2228.2228.2228.2228.22
Total Share Capital28.2228.2228.2228.2228.22
Reserves and Surplus17,849.2516,710.3714,781.2913,198.0511,913.87
Total Reserves and Surplus17,849.2516,710.3714,781.2913,198.0511,913.87
Total Shareholders Funds17,877.4616,738.5914,809.5113,226.2611,942.09
NON-CURRENT LIABILITIES
Long Term Borrowings2,660.822,571.743,112.583,131.172,831.45
Other Long Term Liabilities405.87163.09192.09205.6588.51
Total Non-Current Liabilities3,066.692,734.843,304.673,336.822,919.96
CURRENT LIABILITIES
Short Term Borrowings495.581,098.61513.02442.60303.03
Trade Payables2,093.131,938.801,622.671,585.051,667.66
Other Current Liabilities956.05304.60258.38258.46224.63
Short Term Provisions97.0199.05109.28102.4085.33
Total Current Liabilities3,641.773,441.062,503.352,388.522,280.65
Total Capital And Liabilities24,585.9222,914.4820,617.5218,951.6017,142.70

ASSETS

ASSETSMar 23Mar 22Mar 21Mar 20Mar 19
NON-CURRENT ASSETS12mnths12mnths12mnths12mnths12mnths
Tangible Assets1,488.671,468.531,490.281,468.821,308.17
Intangible Assets257.28283.79232.22143.13105.32
Capital Work-In-Progress159.07101.1793.31152.50209.18
Intangible Assets Under Development13.277.8738.0947.5277.02
Fixed Assets1,918.281,861.371,853.891,811.961,699.68
Non-Current Investments10,334.018,559.396,989.954,713.933,268.75
Deferred Tax Assets [Net]946.75923.27853.29804.74712.13
Long Term Loans And Advances6,874.077,078.635,930.707,115.556,263.93
Other Non-Current Assets127.6388.9180.5781.5357.06
Total Non-Current Assets20,200.7518,511.5615,708.4014,527.7012,001.54
CURRENT ASSETS
Inventories1,090.21951.66762.39837.50911.21
Trade Receivables2,505.662,678.322,488.751,835.242,087.13
Cash And Cash Equivalents93.7929.6315.7988.26256.48
Other Current Assets695.51743.311,642.201,662.901,886.33
Total Current Assets4,385.184,402.934,909.124,423.905,141.15
Total Assets24,585.9222,914.4820,617.5218,951.6017,142.70

OTHER ADDITIONAL INFORMATION

OTHER ADDITIONAL INFORMATIONMar 23Mar 22Mar 21Mar 20Mar 19
CONTINGENT LIABILITIES, COMMITMENTS
Contingent Liabilities3,922.953,699.684,012.994,663.263,894.11
CIF VALUE OF IMPORTS
EXPENDITURE IN FOREIGN EXCHANGE
Expenditure In Foreign Currency1,271.221,348.241,202.321,888.122,285.86
REMITTANCES IN FOREIGN CURRENCIES FOR DIVIDENDS
Dividend Remittance In Foreign Currency
EARNINGS IN FOREIGN EXCHANGE
FOB Value Of Goods
Other Earnings4,646.373,214.233,575.274,773.676,299.84
BONUS DETAILS
Bonus Equity Share Capital15.8415.8415.8415.8415.84
NON-CURRENT INVESTMENTS
Non-Current Investments Quoted Market Value3,975.014,659.120.070.030.10
Non-Current Investments Unquoted Book Value10,332.508,557.906,989.884,713.903,268.
All data is taken from moneycontrol

Glenmark Pharma Ltd. Share Price Target 2024, 2025, 2026, 2028, 2030, 2040 and 2050

Glenmark Share Price Target 2024

MonthMinimum Target (₹)Maximum Target (₹)
January850900
February875915
March915945
April9701040
May10101050
June9751015
July920970
August880925
September930970
October9601005
November9891052
December10251092
Glenmark Share Price Target 2024

Glenmark Share Price Target 2025

MonthMinimum Target (₹)Maximum Target (₹)
January900950
February910945
March920960
April9501005
May10001050
June10301080
July10501100
August10551090
September10501095
October10551075
November10101050
December9801020
Glenmark Share Price Target 2025

Also Read: IRFC Share Price Target 2024, 2025, 2026, 2028, 2040 and 2050

Glenmark Share Price Target 2026

MonthMinimum Target (₹)Maximum Target (₹)
January950990
February9851040
March10201060
April10501105
May11001150
June11401200
July11901245
August12001250
September11601205
October11301170
November11351185
December11731205
Glenmark Share Price Target 2026

Glenmark Share Price Target 2028

MonthMinimum Target (₹)Maximum Target (₹)
January14201450
February14251455
March14501500
April14701520
May14981575
June15351606
July15221572
August15461586
September15721603
October15971632
November16121643
December16271664
Glenmark Share Price Target 2028

Also Read: Jio Financial Services Share Price Target 2024, 2025, 2026, 2030, 2040, 2050

Glenmark Share Price Target 2030

MonthMinimum Target (₹)Maximum Target (₹)
January19201955
February19251950
March19502000
April19902024
May20062045
June20302050
July20702086
August20502095
September20732106
October20892126
November21012143
December21192159
Glenmark Share Price Target 2030

Glenmark Share Price Target 2040

MonthMinimum Target (₹)Maximum Target (₹)
January29352960
February29402980
March29452975
April29552980
May29632970
June29762989
July29862998
August29983018
September30053026
October30143038
November30223046
December30273060
Glenmark Share Price Target 2040

Glenmark Share Price Target 2050

MonthMinimum Target (₹)Maximum Target (₹)
January36353680
February36423688
March36533693
April36623701
May36693711
June36763718
July36833727
August36803732
September36843728
October36923735
November36983742
December37023753
Glenmark Share Price Target 2050

How to Buy Glenmark Pharma Ltd. Share

Glenmark Pharma Ltd. listed on NSE and BSE. There are many brokers registered by SEBI to buy shares. Shares of any company can be easily bought and sold through these brokers. Some popular brokers are –

  • Zerodha
  • Groww
  • Angel One
  • Upstox

Disclaimer – Please note that we are not SEBI-registered advisors. Our post is for educational purposes only. Therefore, before investing in any share, take advice from a SEBI certified expert. If you invest, you yourself will be responsible for your profit and loss, not us.

5/5 - (1 vote)

Leave a Comment

Number of Tesla employees worldwide? Yami Gautam’s film ‘Article 370’ OTT released: Watch here! Why is 2024 GoaFest being organized in Mumbai instead of Goa? Can I learn trading from books? 5 Trading Book: Must read these books before investing. Golden Globes Awards Date Has Been Announced: View Nominations Details. Alia Bhatt wore a necklace worth Rs 20 crore at the Hope Gala 2024! This director is returning after 2 years with a film worth Rs 1000 crore. S. S. Rajamouli will take “0” money for his next film! Aishwarya Rai’s father is no more! Share photos on social media.